Updated: Request for retraction of “Net neutrality and high-speed broadband networks: evidence from OECD countries”, by Wolfgang Briglauer, Carlo Cambini, Klaus Gugler & Volker Stocker
Update 09–01–2023: The editors have replied that they see no reason to retract the article. They have invited me to write my own article and submit it through the usual review process. The authors haven’t responded at all. Off the record I’ve had some positive and negative reactions from economics professors. Apparently it’s a biblical truth that IP-interconnection is a two-sided market, even though I explained why it isn’t. So basically nothing changes and this has been lots of effort with little effect. That said, there is a nice addendum on how interconnection pricing works at Deutsche Telekom.
Tuesday November 15th I sent an e-mail to the authors and editors requesting the retraction of the article by Briglauer, W., Cambini, C., Gugler, K. et al. Net neutrality and high-speed broadband networks: evidence from OECD countries. Eur J Law Econ (2022). https://doi.org/10.1007/s10657-022-09754-5. This was with a heavy heart, but the article contains too many methodological and factual issues and an even heavier heart that I publish the whole email and some background here on my blog. It is only a day later. I haven’t received a response to the email from the authors or editors of the European Journal of Law and Economics. I don’t expect a response anymore now <author X> blocked me on LinkedIn.

Background
For those who don’t know me. I’ve been working on telecom and internet policy for two decades now. I have a masters degree in Public Administration and Public Policy from Twente University in the Netherlands in 2001. It is in Twente that I started my carreer at the NDIX internet exchange, learning about interconnection. I worked as a policy advisor at the Dutch ministry of economic affairs. It is there where I wrote my first report on net neutrality in 2006, of which only a reference in Kocis and De Bijl 2007 remains. The section on peering and transit I later translated and was published on Ars Technica. I worked at the OECD from 2011 to 2015 doing analysis and writing reports for the Working Party on Communication Infrastructure and Services Policy. There I initiated and organised the two “BEREC expert workshop on IP-Interconnection in cooperation with OECD” in 2011 and 2012, because I realised that telecom regulators and IP-interconnection people didn’t know each other and this created misunderstandings. Those meetings had a positive effect on the position of BEREC and the EU towards the ITU WCIT conference in 2012, where ETNO (like before and still today) tried to impose the anti-competitive and destructive sending party network pays model.
Since then I’ve become a consultant and I consult among other topics on net neutrality to regulator and tech firms. I am and have been in favor of net neutrality and have always been clear of that. One of the roles I have and for which I’m sometimes thanked in academic papers is, that I can explain how the internet and interconnection works. For example when a telecom CEO says traffic growth is too much, I will show that average traffic on his network is 3Mbps and his firm has told investors that it can handle traffic growth with ease.
So whenever academic work is published on net neutrality I’m interested.
My interaction with economists on net neutrality through the years.
To be fair, my experiences with economists on the topic of telecommunications policy in general; broadband, investment, interconnection and net neutrality hasn’t always been positive. When working at the OECD it was normal to find that academics from the field of industrial economics would write articles slaughtering OECD reports and recommendations, based on their own datasets, research or a theoretical model that somehow questioned the empirical data and conclusions me and my colleagues had gathered. Surprisingly, not many who criticised would contact before publication or ask for clarification. Regularly a telecom firm was cited as having funded the research, though the statement generally also said this hadn’t affected the results. Surprisingly, the results were always more favorable to the telecom firm than the OECD’s results.
When contacting industrial economists through the years about what I perceived as mistakes, misunderstandings or possible options for improvement in their articles, I generally found them less then willing to make changes or address my concerns. Their articles almost always come with some comment on how policy makers should pay attention to their model and its results. At times there are even statements that they showed the government policy or the underlying research to be flawed. The reverse somehow doesn’t appear to be possible. Some responses I heard (if I got them):
- Thank you very much for your comment, but I’ve moved on to other projects
- Thank you, but the article we wrote is about a theoretical situation, so we understand that it doesn’t fit your empirical description of the telecom market. We may include that in a future article
- Telecom firm X has told us how the telecom market functions and this is different from what you say is the case.
- Our article reflects the state of academic discussion including those of nobel prize winners
- The reviewers and my professor thought it was good.
- Why don’t you write your own peer reviewed article on this.
Last year I received a similar response when I contacted author Briglauer on a paper he published then, that was sponsored by Deutsche Telekom. That article I had found through a blog post of Deutsche Telekom on repealing net neutrality, because it can’t handle 7MB of Youtube traffic per customer per day sustainably. (357Terabytes for 53M customers in Germany) The article argues against netneutrality and for sending party pays based on the imagined energy use of sending data in networks. It uses an out-dated and mistaken dataset on energy use of data networks based on the unscientific kwh/gb metric. The authors had missed that energy use has remained stable for a decade. Networks use energy primarily for achieving a certain distance with the signal, the modulation is irrelevant. I received a similar response to other academics. That the article was based on academic sources and had been peer reviewed. When I asked a Dutch professor on how I coud deal with this; the response was that sending a letter to the editor could be an option, but often editors choose not to publish the letter. I left it there.
Now I will admit that I may just be a fool and wasting the valuable time and brain cycles of industrial economists with my crackpot ideas. For some reason academics in other fields; law, sociology, technology etc have proven much more willing to interact and discuss.
My interaction with the authors
A week ago I learned of the article of the four authors through a comment of someone I’m linked to on the Linkedin profile of <author X> who promoted the publication of the article. I read the report and saw some elements that got me positively excited:
- Not just a theoretic article, but empiric data
- Data that had a novel way of looking at investment
- Some of the authors I knew and had a positive image of.
When reading it, I saw some classic mistakes, such as a theoretic model that assumes a two-sided market and the assumption that net neutrality bans payments between content providers and ISPs for terminating interconnection, the so-called Zero Price Rule (ZPR). I asked some questions publicly on LinkedIn and then asked <author X> to connect on LinkedIn to allow a more direct chat.
I expressed my concerns and <author X> responded. I had misunderstood one element of how the econometric model was created, which he clarified for me. I expressed three concercs which he responded to:
- On my comments that the ZPR wasn’t present in EU regulation and therefore the channel identified in the theoretic section of the paper that would affect investment, the response was: No, the ZPR is one — comparatively easy — way to illustrate formally the effect of imposing a constraint on profit maximizing ISPs, just as NDR would be (if binding, both reduce profitability, because if ISPs would otherwise engage in such practicies, it would increase their profits — which just follows from the profit maximizing assumption; in that sense the model is generic in simulating / describing the effect of some kind of binding NNR on ISPs profits and related investment decisons.) (NDR= Non-discrimination rule, NNR = Net Neutrality Rule) This shocked me, because apparently a theoretic model that doesn’t describe the empirical situation is not relevant for empirical conclusions.
- On my comment that authors had found a correlation but failed to find a causation the response was: second we argue we do identify causal effects in the empirical analysis; the whole section “identification strategy” is about this, which has been accepted by anonymous referees in a rigourous review process. hence, if you argue that we still have identified correlations only you would have to argue this on solid econometric grounds. So because the reviewer didn’t catch that the theoretic model doesn’t apply to the empirical data, I have to show that the econometric model isn’t sound. So I did that in the e-mail below. Good thing I always loved broadband statistics.
- To my argument that EU telcos, such as Deutsche Telekom and Orange were charging for interconnection and that almost all netneutrality cases in the EU had been about zero rating, which the theoretic model completely fails to address, the response was; third, yes, just because there are peering agreements in the real world re IP transit etc does not imply that NNR (imposed on terminating part of networks) could have had no (partial) impact on investment. Same logic applies to mobile cases you refer to, in both cases you simply do not have the counterfactuals supporting your argument (e.g. NNR might have had an impact on wireline ISPs as they were obeying to the NNR … there might be dozens of reasons why we had mobile related cases only …. zero rating we dont have as such in fixed broadband, right?, etc …
I then started working on a detailed analysis of the article and also of the authors it cites as references and other work of the authors to see what the article is based on. I got increasingly worried the more I examined the article. I had first been primarily concerned about the theoretical model and that concern proved valid. As <author X> requested I then looked at the econometric work, because it had been in a rigorous review by an anonymous reviewer. What I found very disconcerting.
I did place a phone call to <author X>, who was surprised, but we spoke an hour on the phone. The call didn’t alleviate my concern, it increased them only more. The author was dismissive of my concerns and even after several requests and explanations refused to give insight into a sample of the datasets used for the article.
The problem with the result of the modelling is that the authors say it shows that countries with netneutrality (the EU) had 25% less investment in FTTH, relative to countries that don’t have netneutrality. That conclusion however hinges on Australia and New Zealand that don’t have netneutrality and didn’t in the period when the EU does from 2016 til today. Those just happen to be the years that Australia and New Zealand invested massive amounts of money in national broadband networks. So the relative difference is a lack of EU wide broadband plan, not the netneutrality regulation.
The econometric model is used in a number of articles by author Briglauer. I looked at these articles and suspect some of the criticism I give below also apply to those articles. Indeed I found it quite concerning that data on government investment in broadband, that was used for another article was not part of this article, despite it being of great relevance to the effect of net neutrality on the investment in high speed broadband networks.
What I hope to achieve
I hope to achieve better academic research. Particularly in the field of industrial economics. Not a week goes by without someone arguing based on economic research that the government should do XYZ in telecom/internet/tech policy. Every now and then I get asked to verify or give my opinion on the article. I really just want to be able to say: “oh by economist X … yeah, that’s probably rock solid!”. My current response is; did you check the assumptions? did you check who funded this article or his previous articles that say the same? do assumptions hold? any empirical data and if so what is the quality? It shouldn’t be like that.
I need to be modest too
Should anyone see mistakes by me, outright stupidities or smaller ones, please do point them out to me. I can generally handle it. I at least think I should! I’m critical of others, but generally to get science further and get better policies for better lives (the OECD-slogan is one of the best I think) I however do often make mistakes. I know my communication style is blunt and I tried to do better.
Addendum 1: An employee of a European content network send a message that the tariff charged by Deutsche Telekom for terminating traffic on its network is a blended price of transit and termination payment. So it may look 20cts per megabit per month capacity, but it really is a termination fee that is high and an additional lower tarriff for transit, which the other may not want or need.
Any network that has significant traffic for Deutsche Telekom finds that commercial transit networks towards DT are saturated (an experience that Deutsche ForschungsNetz had too). The network than requests Deutsche Telekom for peering. Deutsche Telekom Wholesale will only offer transit. The price of transit is different for different AS-numbers, based on whether they are a telco like Deutsche Telekom, CDN or hosting provider. This is odd, because networking protocols can’t see a difference and there is no cost difference. Hosting apparently pays more than CDN and telco. The network than tells Deutsche Telekom it has enough transit capacity and doesn’t need more.
Deutsche Telekom however insists, it’s either transit or nothing. The transit price for 100Mbps may be 20 euro per month. The hosting network only has 25Mbps of traffic in either direction with DT. The price for terminating traffic translates to around €0.80/Mbps/per month. 4 times more than I wrote based on WIK. The content provider can then choose to use the transit or not. If the content provider wants only 50Mbps than DT will tell it the price is 40cts/mbps so €20/mbps/month too.
However requesting to only pay for the traffic that terminates on DT, paying only the blended price of €0.20/mbps/month is met with disbelief. It still costs €20/month for 25Mbps. If the content provider doesn’t agree, the only alternative is to route through networks DT has a friendly relationship with and that have a similar price point. This is similar to the Swisscom-Init 7 case referenced below. Mind you, Swisscom lost in court for exacting a termination monopoly with a revenue split with Deutsche Telekom for all traffic destined to Swisscom routed over Deutsche Telekom.
Addendum 2: The authors submitted a different version of the article to Ofcom as a response to the consultation on network neutrality held in 2021. This article contains a graph, that illustrates why I am concerned. The fiber investment growth rates that are graphed are for the whole EU, the whole US and Australia and New Zealand combined. This is exactly what I’m worried about, that by the different scale of these countries, combining 27 countries in the EU and by omitting that the national broadband plans of AU and NZ went full steam in those years, the authors found correlation but not causation. The graph was omitted in the final article, so maybe there is more wrong with it. I don’t understand what is on the Y-axis. Is it in percentages? Is it the growth of the growth? The USA goes negative at 2017, so is that less fiber, or just less growth than a previous year? To me it shows the authors use very few data points and a too short time scale for their anlysis.

In its 2022 net neutrality review Ofcom mentions the article in a footnote; 271 We are aware of some academic empirical evidence suggesting that net neutrality rules can exert a negative effect on network investments and other outcomes, although the scale of the impacts found and methodologies create some uncertainty about the probative value of these results (e.g. Briglauer W, Cambini C, Gugler K, & Stocker V, 2021, Net Neutrality and High-Speed Broadband Networks: Evidence from OECD Countries). This suggests that Ofcom isn’t convinced by the contents of the article either. Ofcom is currently doing a consultation on this review.
The e-mail with requests and criticism
Dear authors and editors,
I read with interest your article on “Net neutrality and high-speed broadband networks: evidence from OECD countries” in the European Journal of Law and Economics. https://link.springer.com/article/10.1007/s10657-022-09754-5 I hereby request a sample of your data to confirm my suspicion that the econometrical analysis mostly relies on the increase in fibre roll out due to the Australian NBN and the structural separation of Chorus in New Zealand and possibly some other countries. However, given the lack of theoretical basis it’s probably best to repeal this article straight away and fix the econometrical analysis in another future article.
I spoke to <author X> today to express my concerns. I understand modelling and data collection is hard. He has not just a unique dataset, he also created a hole new type of datapoint with regards to fibre based networks. By summing up the individual types of networks from VDSL2, Docsis to FTTH, I’m almost certain there will be some weird artifacts in the data that will make it harder to do proper analysis. I also realised that at least <author X> wasn’t aware of the legal context of netneutrality and didn’t know that termination payments are legal in the European Union. This means that the entire theoretical basis for the article falls away as the entire Appendix 1 describes a situation of interconnection. As BEREC states:
Para 50. As Article 3(3) concerns the equal treatment of all traffic “when providing internet access service”, the scope of this paragraph excludes IP interconnection practices.
It is very good that you have attempted to do empirical work on net neutrality, instead of the theoretical work that is so prevalent in industrial economics. It is unfortunate that I find so many methodological, data and factual issues with the article. These are in a large part caused by the theoretical errors in the work of your colleagues.
Request for sample of data
I would like to request access to a sample of the underlying data used to do the econometric analysis. In particular the proprietary data from the FTTH Council (I assume that is the iDate data?). The sample I would like to receive is:
- the values used for fiber-to-the home (FTTH) and fiber-to-the building (FTTB), as well as the hybrid fiber technologies fiber-to-the cabinet (FTTC) and fiber-to-the last amplifier (FTTLA).
- Values for basic broadband and basic cable used
- Countries: Australia, Belgium, EU27 (totals), France, Japan, Korea, the Netherlands, New Zealand, United States
- period 2009–2012 and for 2014–2019, or if that is no problem, the whole time period, however I can imagine you don’t want to hand-over proprietary data.
This sample would be enough to confirm or refute my suspicion of serious methodological issues with the compilation and analysis of the dataset.
Theoretical model doesn’t apply to the empirical situation.
Your theoretical model doesn’t describe the netneutrality regulation in the European Union and its effects. To make it worse, it also doesn’t describe how the telecommunications market functions for ISPs. I know the theoretical models you reference have been widely used and discussed in academic literature. I’ve contacted several of those authors through the years. The answer I generally get is that the model is theoretical and isn’t intended to be an accurate description of how interconnection between CPs and ISPs functions. So that puts the burden on you to verify whether your model actually does reflect the situation in the EU.
With regards to the theoretical underpinnings both in the literature review and Appendix 1 the major issues are:
- The theoretical description of how net neutrality affects investment decisions lacks verification of whether the theoretical assumptions hold in the empirical situation analysed. In my opinion it should have been included.
- The model in Appendix 1 assumes a two-sided model. The assumption that an ISP is a platform provider is very common in economic theory, but wrong. An ISP is not a platform provider in a two-sided market. It doesn’t meet the essential criteria (see https://pure.uvt.nl/ws/portalfiles/portal/1410181/2012-008.pdf for an overview of such criteria, for example positive network externalities). Indeed, as BEREC says in para 15. BEREC understands the term “connectivity to virtually all end-points” as a consequence of the fact that the internet is a distributed system where a single ISP controls a rather limited part. Due to reasons outside the control of an individual ISP (e.g. technical limitations, the policy of other ISPs or regulation in some countries), not all end points might be reachable all of the time. However, such a lack of reachability should not preclude that the service is defined as an IAS.: This can be easily demonstrated. The Internet is a network of interconnected networks. There are currently 75,219 of those interconnected networks with their own routing policy active on the Internet. https://bgp.he.net/report/netstats. 3000 of those in Germany, 700 in Austria, 1700 in the Netherlands, 1400 in Italy. Each of these networks provides access to all those other networks. The customer of the ISP doesn’t choose the ISP based on how many networks it connects to. It is assumed all can be reached. Indeed, if you read this at university, then your national research network ACOnet, DFN, GARR is how you access the Internet. Consumers choose ISPs based on who is available, services offered and price. Where for TV the number of channels might be relevant, it is definitely not relevant for the Internet. The theoretical model is not an adequate base to determine the channels through which regulation affects investment. Empirically the internet works more like 75 thousand individual networks who have a choice to buy transit, build out fibers and to interconnect directly or through others. To put It differently; let us say you choose to start a website about your cat and that website becomes really popular in Argentina. Neither your ISP here in Europe or the ISPs in Argentina have done anything in that market other than carry the bits. Just like the postal service carries the letters and packages. You as content provider didn’t choose to host the website with a European ISP to become popular in Argentina, but you nothing prevents it from becoming popular there.
- The model assumes that net neutrality rules would lead to a Zero Price Rule, which would mean that ISPs can’t charge Content Providers for interconnection. There is no country that has net neutrality rules that contain a Zero Price Rule. The EU rules most certainly don’t have a ZPR. As BEREC says in para 50; IP interconnection is excluded. That networks can and do pay for terminating traffic can be empirically shown. It is why Deutsche Telekom could charge German universities money when students weren’t able to follow online classes during Covid lockdown. https://www.heise.de/newsticker/meldung/Deutsches-Forschungsnetz-und-Telekom-Peeren-in-Zeiten-von-Corona-4694172.html Arcep reports termination fees (paid peering) of up to several euro per mbps. https://en.arcep.fr/uploads/tx_gspublication/report-state-internet-2022-300622.pdf WIK reports that Deutsche Telekom charges around 20cts per mbps for terminating access. https://www.bundesnetzagentur.de/EN/Areas/Telecommunications/Companies/Digitisation/Peering/download.pdf?__blob=publicationFile&v=1 The Dutch ACM also explains this in significant clarity in chapter 4.3 of its market study on IP interconnection https://www.acm.nl/system/files/documents/study-into-the-market-for-ip-interconnections-2021_1.pdf
- The theoretical model would be best served by looking at various types of interconnection models. In 2013 I explained the various models in this OECD paper https://www.oecd-ilibrary.org/science-and-technology/developments-in-mobile-termination_5k9f97dxnd9r-en The model to apply in this case is a combination of peering and transit, which I also explain here https://arstechnica.com/features/2008/09/peering-and-transit/ A termination monopoly best describes the case of telcos such as Orange, DT and Swisscom. For the Swisscom case see https://www.inside-it.ch/exklusiv-naechste-runde-im-peering-streit-zwischen-init7-und-swisscom-20220506
- Your model can’t explain why many ISPs, including large ones such as BT choose to peer and don’t ask for a termination payments. The model of peering and transit does provide a basis for this. Furthermore your two sided market assumes that there is some benefit obtained in the quality of the network by paying the ISP. In practice we see that networks aren’t saturated and that payment doesn’t lead to better performance. Traffic growth is not an issue. See for example BT https://indico.uknof.org.uk/event/42/contributions/555/attachments/752/924/UKNOF40-MCRAE-WEBSITE.pdf
- Your model can’t explain why Deutsche Telekom decided to route all of the traffic of its Dutch subsidiary through Germany in 2019, breaking the Internet for its Dutch customers. Nor why it reversed that decision within a few days. It’s the same platform, with the same customers, so why didn’t the other networks pay Deutsche Telekom to be connected to the customers they lost connection with? https://rudolfvanderberg.medium.com/t-mobile-nl-routed-all-internet-traffic-through-germany-and-broke-the-internet-for-small-firms-a176855d2b0
- Net neutrality regulation in the EU and USA focus primarily on non-discrimination and anti-competitive bundling (eg zero-rating). How this can affect investment incentives, your theoretical analysis doesn’t address at all.
- You have no estimate of the size of the theoretical effects based on empirical data. Even if ZPR would be a channel, we would be talking about 20ct/Mbps per month for Deutsche Telekom all across Europe, which given 80 terabit capacity would amount to at most €200M/year. Mind you, that is a very high estimate. Interconnection traffic in France is according to Arcep 43Tbps or 1.5Mbps/subscriber peak. So at 20cts/mbps we would speak of 30ct per subscriber/month and €9 million/month for all French ISPs. Given that average French broadband subscription prices are around 25–30/month ex VAT, we’re talking about 1% of revenue.
- The quote of Akerman is altered and doesn’t represent the intent or the meaning of the original quote. You say: In a similar vein, Akerman et al. (2015), examining basic broadband investment, summarize as follows: “We find that 89% of the variation in broadband coverage can be attributed to time-invariant municipality and industry characteristics and common time effects, while less than 1% of the variation in broadband coverage can be attributed to a large set of time varying variables.”. There are 25 different versions of that paper available around the web, your quote appears to be from earlier versions. The quote should be about availability: We find that 88 % of the variation in broadband availability can be attributed to time-invariant municipality characteristics and common time effects, while less than 1 % of the variation in broadband availability can be attributed to a large set of time-varying variables. In addition the way you use the quote in the article is incorrect. The roll out of broadband in Norway varied greatly by municipality, but those differences were attributable to variables that are stable. In this article you appear to use it as a justification that the variation between countries is similarly attributable to time invariant characteristics, which of course can’t be done. Municipalities in Norway can’t just be scaled op to 34 OECD countries. If that was true, the North of Germany should have just as good broadband as Denmark or the Netherlands.
- The conclusion states that: a regulatory preference for network investments over the use of network management to avoid long-lasting or recurrent states of congestion . That is a bold statement, particularly because you can’t show a recurrent state of congestion. I have explained this in some detail to NLNOG recently, but average peak traffic per household doesn’t exceed 5Mbps. Deutsche Telekom’s Terastream network is designed for 40Mbps per subscriber peak traffic. Other networks have more capacity. Total capacity per country for interconnection therefore is 5Tbps/million subs times 2 or 3 for redundancy and capacity growth. Given that Nokia sells 240Tbps routers, there is no telco in Europe with a capacity problem. https://nlnog.net/nlnog-day-2022-the-20th-anniversary-edition/
I could continue, however the model you develop in no way describes the market situation as it functions, nor the effects net neutrality would have on financial flows between ISPs and Content Providers, nor would the effects be very significant. I’m well aware that there are many other theoretical models like yours… However those academics said it was theoretical and didn’t try to apply to empirical situations. Or said differently, those models aren’t even wrong.
Of course, despite a lack of theoretical basis, there might still be a correlation between net neutrality regulation and investment levels! Theory is there to be improved by excellent empirical analysis. That would still mean a significant part of the article should be rewritten in chapters 2 and 3 and the Appendix 1 should still be deleted.
Econometrical analysis, first verify the assumptions for the model
As requested by <author X> I’ve done an assessment of the econometrical model. My issue isn’t with the arithmetic. The choice of data and the way those data are processed are already such a significant concern that the arithmetic performed with it is on quicksand. If you could give me access to the sample I can further confirm this suspicion.
You estimate empirical models of investment in new (fiber-based) broadband access capacities (fiber_inv). Considering the relationship between fiber investment and fiber subscription, the former is logically a pre-condition for the subscription decision of consumers. The way you do this, raises some significant questions. I would like to look at a sample of your data to see to what extent your dataset can support your analysis. Some points that show problems with the building of the model:
- The way you calculate ln(fiber_inv) in a country is novel. Nobody has compiled this statistic ever before. “ln(fiber_inv). Fiber investment is measured in real terms as the absolute number of connections deployed, representing newly installed fiber-based broadband Internet access capacity in a given country”. As far as I can see from your paper and based on my own experience, I haven’t seen this approach anywhere else in literature. This puts a burden on you to describe the validity of the approach. Such a description is lacking. The other articles dr. Briglauer wrote based on this data have the same omission.
- Ln(fibre_inv)=Ln(SUM:(FTTC, FTTN, FTTH, FTTB), which means that you see VDSL, Docsis and FTTH as equal technologies that are complete substitutes with no qualitative differences. This is technically not true, but also not true in the perception of customers. KPN Netherlands has 40% or less market share in areas where it has VDSL and competes with either Docsis or FTTH of another ISP. In areas where KPN has FTTH its market share against Cable networks is above 50%. So consumers in the Netherlands say FTTH is Better than cable, but cable is better than VDSL.
- Ln(fibre_inv)=Ln(SUM:(FTTC, FTTN, FTTH, FTTB) also means you can’t see the difference between Ln(SUM:1, 2,3,4) and Ln(Sum:7,3,0,0).
- Ln(fiber_inv) is the log of the sum of the total number of VDSL, Docsis and FTTH based homes passed in a country. Even before taking the log, there ae some elements to consider: This means that some countries have significantly more than 100% coverage. For example my own country, the Netherlands. However, what is unclear is how log of the sum of these numbers prevents you from missing replacement investment in fiber based networks.
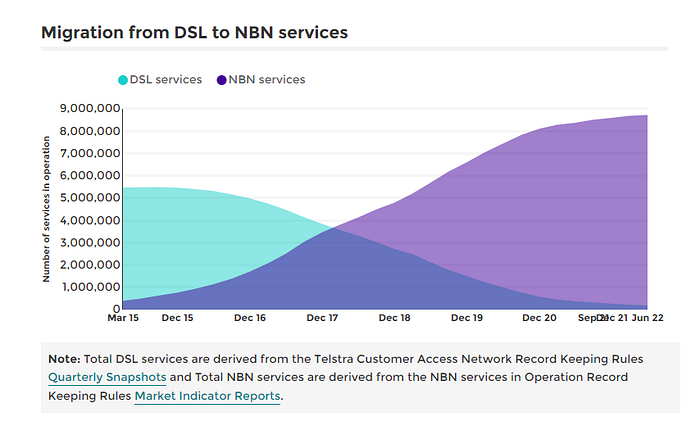
- This can also be shown by data from Australia: The Australian NBN has replaced the Telstra network. That looks like this snapshot below: https://www.accc.gov.au/regulated-infrastructure/telecommunications-and-internet/national-broadband-network-nbn-access-regulation/nbn-wholesale-market-indicators-report/june-quarter-2022-report The data from NBN in the excel says the total of FTTC, FTTN, FTTB, FTTC and HFC is 8.2 million, out of a total of 8.7 million connections. When looking at the speed tiers provided, a different image emerges. 2.1M connections are 25Mbps maximum. That’s basic DSL and wouldn’t qualify as fiber based in most countries.
- To further complicate the analysis.. In the Netherlands some HFC networks have shut down their cable network and completely moved to FTTH. It would appear that the iDate data would show a move from one category to another for this shift, but it wouldn’t show a difference in ln(fiber_inv). Similarly KPN has VDSL2 active in much of the country, but actively moves customers to FTTH. It intends to shutdown its copper network. Such a shutdown would show as a decrease in fiber investment.
- Ln(fiber_inv) would need a thorough analysis for the various categories it comprises of and how the changes in the categories affect the dependent variables.
- Activation of technology can mean that a connection moves from one category to another without significant investment. VDSL which your data probably qualifies as Fibre based compared to DSL was switched on in France on October 24th 2014. It was a big bang. Many French ISPs had been ready for a few years already, but for technical reasons had to wait. In my apartment bandwidth increased six fold on that day.
- <author X> appeared to think that all fiber based networks require significant build out to street cabinets etc. This is not the case for many VDSL based networks and the fiber build out for most HFC based networks was finished at the start of the millennium. At the same time loop lengths in France were very long because of France’s late deployment of telephony. It had to deploy fiber much deeper to villages at the start of the millennium to be able to do DSL at all, because DSL is limited to 5KM.
- There appears to be a mistake with the definition of EU+. For some reason table 6 omits: Bulgaria, Croatia, Finland (OECD), Iceland (EEA, OECD), Latvia (OECD), Lithuania (EU, OECD), Luxembourg (EUOECD),
- With regards to the NNR dates the date that the regulation went into force is more correct.
- Table 6 has bad and out of date references. In general it would be appreciated if you at least cite a government or other document with full name and title, not just some link.
- NNR dates of Table 6 have several errors:
- The OECD Communications Outlook 2013 table 2.9 isn’t referenced properly in the references, despite being mentioned in the table. I was responsible for that table when I worked at the OECD. Which also means I should have paid more attention to the responses of the countries. https://www.oecd.org/sti/broadband/2-9.pdf My apologies for not catching Finland’s error.
- The NNR date for the EU is set at the time of the EU Directive adoption, however it went into force on April 30th 2016.
- Finland didn’t have net neutrality regulation. The reference is probably from the OECD table, but article 68 which is mentioned in the OECD table and which you appear to refer to was already in the telecom law of 2003 and is the same non-discrimination rule present in other EU telecom laws. https://www.finlex.fi/en/laki/kaannokset/2003/en20030393.pdf
- Israel had a netneutrality law for mobile in 2011 extended to fixed in 2014.
- The Netherlands; the date the regulation went into force is 1–1–2013.
- For some reason Norway is omitted in your list. It had NNR in 2007
- The description of L.NNR also shows a misunderstanding of how public policy is formulated. It generally takes significant time for a country to formulate policy of any kind. The formal introduction in parliament is the result of a process of several years. What you currently estimate is how controversial the rule was and how efficient the country’s parliament, not necessarily whether the industry could be prepared. In the Netherlands our debates on NN started in 2006, when I wrote a discussion paper on the topic for the Ministry of Economic Affairs.
- Canada started in 2008 already https://crtc.gc.ca/eng/archive/2008/pt2008-19.htm
- The EU had controversial debates ever since 2011 https://www.manchesteropenhive.com/view/9781526105479/9781526105479.00024.xml?chapterBody=pdf
- Luxembourg had a parliamentary decision to call for net neutrality in 2011, though it pointed to the EU to realise it, it was clear Luxembourg wanted it.
- The political variable “left wing” and its description shows a bias by the author towards the policy of net neutrality. One could just as well say that right wing parties favour collusion, terminating monopolies and collusion, whereas left wing parties favor level playing fields and competition.
- The values chosen for left or right wing should be available for verifications. The way it is obtained I was first critical of, but on second thought looks quite clever. The EU ellections are at least less often than election in some EU countries. That said, it would need references to political science studies to show the values fit with the results of other academics.
- Population density: common mistake in broadband studies is to take the total surface of the country, better is to look at the landmass where 80–90% of the population lives.
- Wireless isn’t generally part of the competition of fibre networks in a country. If anything the bundling of mobile subscriptions with fixed line broadband hinders some competition in fibre roll out, as it raises the switching barriers for consumers
- You say: Gov_spend measures the overall degree of governmental spending in the economy. We expect that more left-leaning governments, as well as governments showing higher levels of public spending, will favour regulatory measures such as interventionist net neutrality regulations.
- This shows a bias by the authors that would need a reference. Take for example the Bush administration and the way it ballooned the US Debt.
- Gov_spend is not related to broadband spending and the authors have provided no support for it. Worse,
- A better variable is broadband spending by the government. Which you could use Briglauer and Grajek for. Particularly because “The most interventionist form of public engagement is in terms of direct infrastructural investment where the government owns parts of or the entire network infrastructure. Australia and New Zealand favored such interventionist approaches and so far have provided the highest per capita state aid funds.6” and The most striking difference is between Australia and the Netherlands, which spent in total $1,721 and $1.5 per capita, respectively, during the period 2003–2018. If we then realise that most of that money was spent after 2015 we can see why Australia saw growth in fiber
- The Hausmann style panel comparisons shouldn’t have just lumped the EU together in a big batch. It basically changes the comparison from 34 to 8 countries. This has greatly limited the validity of your results. 2 outliers (Australia and New Zealand) can mess up your results dramatically, because it is 25% of your sample size. Some ways you could’ve improved it is:
- Distribute the EU in 5 random groups of 5 countries and see how it holds
- Distribute the EU in 5 groups with high FTTH compared to countries with low FTTH.
- Distribute the countries based on how much cable competition they have
- Distribute the countries based on the amount of government investment in broadband they have.
- Etc.
- You could have a look here for additional panel data https://stats.oecd.org/Index.aspx?DataSetCode=BROADBAND_DB#
- The number of countries in the table, though technically correct appears to overemphasize how many you actually use for comparison. You often lump the EU 27 together
- The timeline you do the research over looks long, but since much of the action happens after 2010 and particularly after 2016, the relevant number of observations is much smaller and therefore more susceptible to data problems
- This also goes for government investment, the numbers for Australia and New Zealand should be corrected by year and not spread out over the analysis period. It is quite a difference; 20K per household in 5 years or in 20 years.
I am sorry it has become such a long mail… particularly because it shows how much is wrong with your work… I will just assume these are honest mistakes and stem from an academic disconnect with the empirical situation outside your institutions. If you have any additional questions feel free to call or mail. A more complex question you should ask is why your field is so focussed on making ISPs two-sided platforms. Do economists get bonus points for working on two-sided markets?
I hope you retract this paper and explain others why science benefits from your honesty.
Sincerely,
Rudolf van der Berg
